
These tools are all you need for your PhD!
Published:
As a PhD student, you are learning cutting-edge techniques. In the future, you will prepare to showcase your impressive work to audiences in your field. To excel in this role, a PhD student needs the best tools. This post will introduce the professional tools that current STEM PhD students use to complete their projects, write their papers, and demonstrate their results.
Writing
The first type of tool introduced in this post is related to writing. As a PhD student, you are often required to write papers, reports, projects, and more. While Microsoft Word is typically sufficient for these tasks, if your work involves numerous equations, figures, or specific symbols, more powerful editing software can significantly reduce your time and effort (and I understand the mountain-like pressure of PhD life).
One such software is LaTeX, known for producing neat and tidy typography. Fortunately, Warwick has purchased the professional plan of Overleaf, an online LaTeX editor. This means you don’t need to download any packages to your local computer. Simply click this link and start your project! There’s also a tutorial available for typing LaTeX text on Overleaf, tailored for you, my dear PhD student! When preparing to submit a paper to an academic journal, you can directly use templates provided by publishers such as IEEE and Elsevier (Click these links for their beautiful templates!).
For lightweight text tasks like class notes, keynotes, and ideas, I strongly recommend using Markdown—a lightweight markup language for creating formatted text. Trust me, you can learn how to use it in just 10 minutes. Check out this short Introduction to get started! You can use the in-browser Markdown editor called Stackedit or download Typora on your local computer for a seamless experience. I am currently using Markdown to write this blog—it’s that simple and effective!
Coding
For most STEM PhD students, coding is essential, as the saying goes, “Talk is cheap, show me your code” :) There are three widely-used coding languages in academia:
- Matlab. Matlab is considered one of the most user-friendly languages for coding newcomers, thanks to its simple syntax and extensive help documentation. It offers a range of toolboxes tailored for disciplines like control engineering, communication engineering, computer science, electrical engineering, and more. These toolboxes are developed by leading experts and professors worldwide. Warwick provides Matlab for all students, available for download from the Warwick Software Centre.
- Python. Python is an elegant coding language currently popular across various fields. Many researchers and engineers are drawn to its open-source ethos advocated by the community. Python is often hailed as a “glue language” for its exceptional ability to integrate diverse programming languages and components. It boasts an easy-to-use syntax, a vast standard library, and a rich ecosystem of third-party libraries. In data processing and artificial intelligence fields, Python has become the preferred coding language for most developers due to its powerful third-party libraries contributed by the community. To start using Python, I recommend downloading the VS Code or PyCharm development environments, both of which are free for students! You can learn Python from this tutorial.
- C++. C++ is a high-level language known for developing many famous applications such as YouTube, Amazon.com, and the Windows OS. However, mastering it can be challenging. Currently, few can confidently claim proficiency in C++. Consequently, the potential benefits of learning C++ are substantial due to high demand in the market. For C++ development, Visual Studio is widely regarded as the premier development environment. Of course, you can also learn C++ from online W3School.
Plotting
Formulas and code often make people sleepy, but eye-catching pictures can immediately capture readers’ attention. While Matlab can plot scatter plots, curves, bar charts, and pie charts (please refer to MATLAB Plot Gallery), I find that the output pictures may not be as visually appealing as I would like. That’s why I prefer using Python packages for data visualization, including Matplotlib, Seaborn, Bokeh, and Plotly. You can learn how to use them by clicking on the corresponding links. Here, I’d like to showcase some gallery pictures plotted using Python.
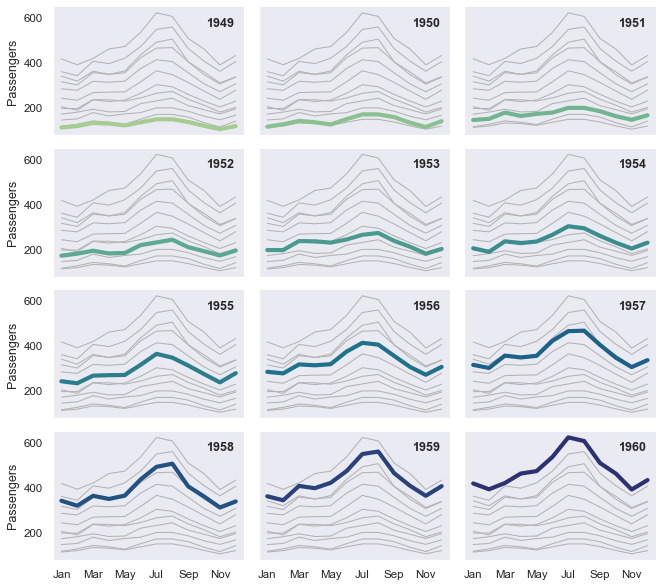

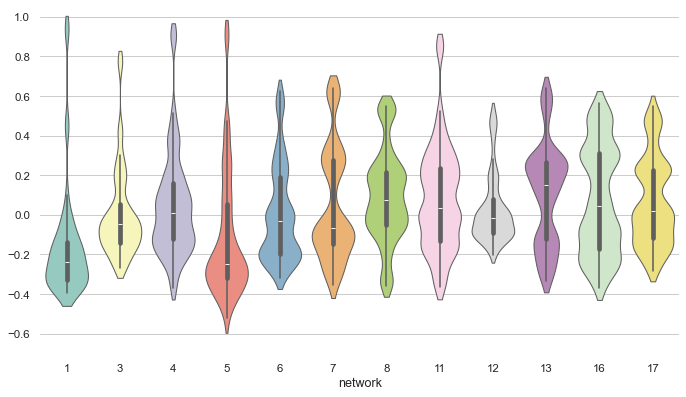
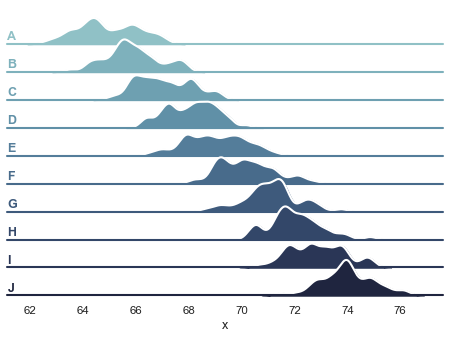
(The figures above are from the Seaborn website.)
If you have other amazing tools that are worthy to recommend with our peers. Please share them on the comments.